Data Artist
Let data speak for itself: In our hands-on Data Artist training, you will learn about the many possibilities of data visualization.
After completing this program, you will not only have the ability to create engaging dashboards, but will also have developed a deep understanding of their structures and the art of storytelling with data. An additional aim of the course is also to critically analyze your own dashboards and optimize them in the course of the program.
What awaits you
Modul 1: Data visualization and dashboard processes
From the design of appealing visualizations to the efficient handling of dashboards –the essential skills for aspiring data artists.
Modul 2: Dashboard types and visual perception
Learn about the different types of dashboards and deepen your understanding of visual perception; presenting data in a way that captures attention and leaves a lasting impression.
Modul 3: Diagram types and dashboard structures
Diagram types, their possible uses and what to look out for in the dashboard structure in order to prioritize and effectively highlight relevant information.
Modul 4: Speedsketching and storytelling
Techniques of speedsketching in the context of dashboard structure and visualization – the best practices of data storytelling.
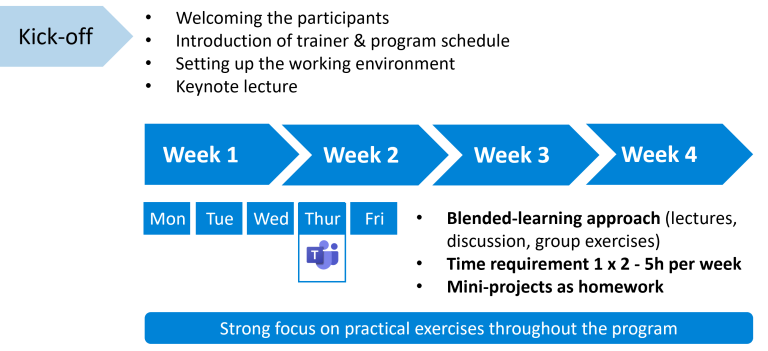
- Duration: 16 hours (live) over 4 weeks
- Blended format: 1x 2 -5 hours live online per week + exercises and self-paced learning
- Target audience: Beginners
- Prerequisites: None
DATA ARTIST TRAINING
AT A GLANCE
DATA ARTIST TRAINING
Learn more about our specialized offering